|
introduction
all phase change thermal interface materials are designed to minimize the thermal resistance in an interface between a heat generating component and a heat sink. how well they achieve this goal in a specific application depends on how judiciously their phase change characteristics are matched to the interface specifications.
the purpose of this paper is to present the results of recent testing performed at power devices, inc. on three different phase change materials to demonstrate that thickness variation during phase change can be measured and to show how it determines performance differences.
the test methods focus on the measurement of thermal conductivity, the thickness change during and after phase change and the resulting thermal resistance. they were developed to reveal the performance characteristics of phase change materials so that the designer will be better equipped to make the best choice for a given requirement.
thermal conductivity
astm d 5470 describes a standard method of determining the thermal conductivity of a thin solid thermally conductive material. the thermal conductivity (k) is defined as the time rate of heat flow, under steady conditions, through unit area, per unit temperature gradient in the direction perpendicular to the area, or
k = q . t / a .  t (1) t (1)
where q = rate of heat transfer, t = thickness, a = area, and  t=(ta-td) is the temperature gradient required to conduct the heat. the equation for (k) can be algebraically rearranged to t=(ta-td) is the temperature gradient required to conduct the heat. the equation for (k) can be algebraically rearranged to
t / k =  t . a / q (2) t . a / q (2)
it is this form that we will be dealing with in this paper. the term  t.a/q is defined as the normalized thermal resistance or the total opposition that an interface presents to the flow of heat. t.a/q is defined as the normalized thermal resistance or the total opposition that an interface presents to the flow of heat.
measurement of the thermal conductivity per d5470 involves measuring the temperature difference at the two interface surfaces with a known steady heat flow through a known area with known increasing thickness of material. the inverse of the slope of the line produced by plotting thermal resistance vs.thickness is the conductivity. the thermal resistance at zero thickness is the interface resistance. when using this technique to measure phase change materials, it is important to use compression stops equal to the thickness of material being tested. it is also necessary to insure that the data is taken above the phase change temperature for the material under test.
the astm d 5470 thermal conductivity test was performed on the three materials being evaluated in this paper. for material a, only the compound thickness is used as the aluminum substrate is transparent in this test since its thermal resistance contribution is only 2.32x10⁻⁷m2oc/w. samples b and c have no substrate so their total thickness must be considered. see results in figure 1.
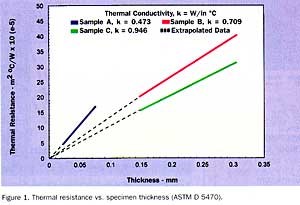
it should be noted that in all cases, the thermal resistance at zero thickness is zero, indicating that the materials have "wetted" the mating surfaces and eliminated the contact resistance. therefore, the thermal resistance will be determined by the ratio of the thickness/thermal conductivity. compound a shows k=0.473 w/moc, compound b has a k=0.709 w/m°c, and c reveals that k=0.946 w/m°c.
at this point, one would suspect that c would produce the best result, however, it is mandatory to examine the thickness and how it varies under pressure and temperature for each of these materials before a final judgement can be made.
|
phase change materials
|
- phase change materials, unlike thermal grease, are in a solid state when they are applied to a heat sink
- phase change materials can be in the form of compound only or supplied on a carrier such as aluminum or fiberglass weave. this is a composite form.
- as heat flows through the interface, a temperature gradient builds up across it and the phase change material softens and eventually turns to a non-solidstate.
- the viscosity of the material in this state varies dramatically from manufacturer to manufacturer and is a key to the performance of a specific compound in a specified application.
- when the material achieves the liquid state, typically at a temperature in the range of 51-60oc, two things happen: 1. the interface surfaces are "wetted" by the compound, driving out all air pockets in the interface, thereby eliminating the contact resistance component of the total thermal resistance; and 2. the thickness of the compound in the interface will decrease in proportion to the applied pressure and will achieve a minimum value dependent on the viscosity of the material and the planarity and curvature of the interface surfaces.
- since the thermal resistance is proportional to the thickness of the material in the interface and inversely proportional to the thermal conductivity, it is important to have a minimum thickness of material that completely fills the interface after phase change and the highest thermal conductivity possible.
|
thickness change
to measure the thickness change that occurs when these compounds change phase, a precision dial indicator was added to the test apparatus of astm d 5470. the indicator was mounted to the base or cooling unit as a reference point and was then adjusted so that the contact point of the indicator rested on the top of the apparatus. therefore, any vertical movement of the top calorimeter would show as a reading on the indicator.
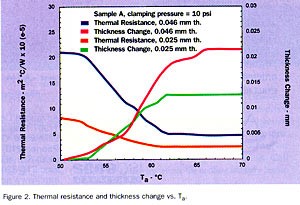
a 50.8 mm x 50.8 mm (2" x 2") sample of test material was placed between the calorimeters and a clamping pressure of 6.89x10⁴n/m2 (10 psi) was applied to the apparatus. the power, 83 w, was turned on and as the temperature increased, readings from the four thermocouples and the dial indicator were recorded. the temperature gradient was used to compute the thermal resistance for each of the samples tested. these results are shown plotted vs. ta , the temperature of the upper calorimeter surface, in figure 2, 3 and 4. also shown in these figures is the thickness change plotted vs. ta for each of the materials.
material a was available in two thicknesses, so both were tested. the 0.0254 mm compound thickness sample tests reveal that as the compound changes phase over the temperature range of 55-62o c, the thickness decreases 0.0132 mm, which produces a final thermal resistance value (ta>62oc) of 2.45x10⁻⁵ m2oc/w. the t/k value at this point is then 1.22x10⁻⁵ m/0.473 w/moc=2.58x10-5 m2 oc/w which is within 5% of the value obtained by the temperature gradient method.
the same tests and calculations on the 0.0457mm thick sample a material were conducted, and it can be seen on figure 2 that the thickness changed from 0.0457mm to 0.0241mm after phase change. the corresponding thermal resistance as determined by the temperature gradient is 4.77x10⁻⁵ m2 oc/w at ta>66oc while t/k=2.16x10 -5 m/0.473 w/moc=4.57x10-5 m2oc/w. note that the sample with the 0.0457 mm initial thickness ended up twice as thick as the 0.0254 mm sample after phase change.
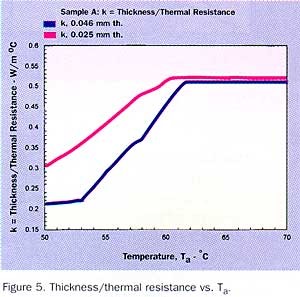
one further calculation was performed by using the data shown in figure 2. the thickness was divided by the thermal resistance and plotted vs. ta in figure 5. it can be seen from this data that the thermal conductivity reaches a post phase change value of 0.51 w/moc which is in close agreement with the 0.473 w/moc value obtained from the astm d 5470 test method. this gives additional validity to the thickness measurements.
material b had an initial thickness of 0.155mm per astm d 374. the thermal conductivity of this compound was determined to be 0.709 w/mo c (figure 1 above) which agrees with the manufacturer's specified value. tests were conducted as described above to determine how the thickness varies with thermal resistance for this material. the results of these tests are shown in figure 3 where it can be seen that the thickness decreased 0.119 mm or ~75% of its initial value. also, it should be noted that this takes place abruptly at 51 oc.
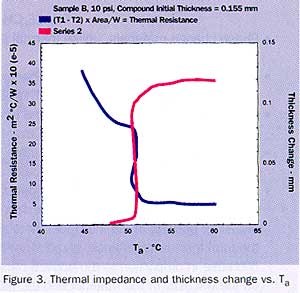
since this material flows rather freely, it was able to achieve a thermal resistance of 4.77x10⁻⁵ m2 oc/w at 6.89x10⁴n/m2 (10 psi). the penalty for this feature is an excessive amount of compound run-out with this material. the value of t/k for this material is 3.56x10⁻⁵ m/0.709 w/moc=5.02x10-5 m2 oc/w which again is within reasonable agreement to the 4.77x10⁻⁵ value obtained by the temperature gradient method and to the manufacturer's specified value of 4.51x10⁻⁵ m2 oc/w at 10psi. also, the value of k=t/thermal resistance=3.56x10⁻⁵m/5.03x10-5 m2 oc/w=0.709 w/moc which agrees with the value obtained by astm d 5470.
material c was found to have an initial thickness of 0.152mm as tested per d374. the thermal conductivity of this compound was determined to be 0.946 w/moc per figure 1 above, which is significantly less than the manufacturer's specified value of 4.0 w/moc.
it should be noted that the test method used to determine this value was not specified. the methods of astm d 5470 provided consistent values for a and b so the value of 0.946 w/moc is assumed to be correct and was used in the rest of the computations for this sample. thermal resistance and thickness tests were conducted on this compound as in a and b above. see results in figure 4.
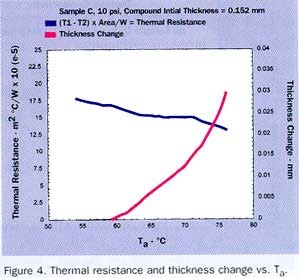
it can be seen from the data shown in figure 4 that this material behaves quite differently from a and b. the manufacturer's specified phase change temperature of 55oc is not evident on this plot. the thickness gradually changed over the ta range of 60-77o c, decreasing only 0.0254mm at ta=75oc giving a thermal resistance value of 14x10-5 m2 oc/w. this material softens and apparently "wets" the interface surfaces, but remains so viscous that it is unable to move much. the resulting t/k=13.5x10-5m2oc/w agrees with the temperature gradient of 14x10-5m2oc/w.
again, if the thickness is divided by the thermal resistance, it reveals that the thermal conductivity reaches a value of 0.946 w/m oc at ta=63oc and this value remains constant for 63<ta<77oc when the test was stopped. this compound does not reach the specified value of thermal resistance of 3.87x10⁻⁵ m2oc/w. perhaps if the test was conducted over a much longer period of time, e.g. days instead of hours, the compound would slowly decrease in thickness providing a better thermal resistance result. if the compound viscosity is high after phase change, time can be a factor in test and application results.
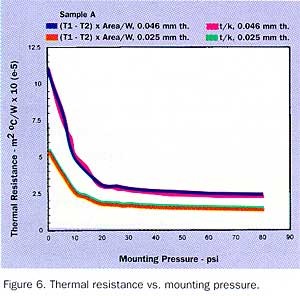
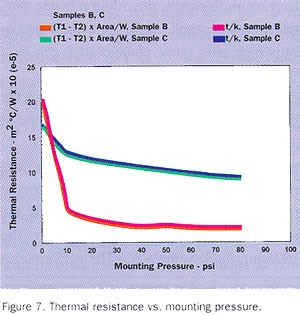
figures 6, 7 show the final results of the thermal resistance and thickness tests at clamping pressures over the range of 10 - 80 psi. in all cases, the t/k value tracks the thermal resistance determined by the temperature gradient method. figure 5 reveals that the best performance is achieved with the 0.025mm thick sample a. the performance of the 0.0457mm sample a and the 0.155mm sample b are approximately the same over this pressure range.
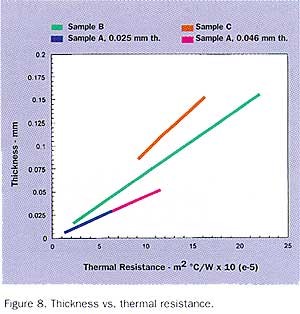
the highly viscous sample c produced the highest thermal resistance values because of its desire to maintain its thickness, even under higher pressures. figure 8 is a summary graph showing the thickness vs. thermal resistance for the three samples tested. the slope of each line is the thermal conductivity. this shows again that sample c has the highest thermal conductivity and the highest thermal resistance, while the thinnest, sample a, produces the lowest thermal impedance values.
conclusions
- thermal conductivity, by itself, is not a reliable indicator for predicting the performance of phase change thermal interface materials.
- the thermal conductivity used in conjunction with the thickness change is a very useful means of predicting performance.
- a manufacturer's thermal conductivity values should be qualified by the test method used to obtain them, e.g. astm d 5470.
- when selecting a phase change material, ask the manufacturer for test data on the rheology of the compound and how the thickness changes with time, temperature and pressure.
- to achieve the lowest thermal resistance, select the thinnest material that is compatible with the application interface specifications.
robert a. rauch
power devices, inc.
26941 cabot rd., bldg 124
laguna hills, ca
references
- astm d 5470, standard test methods for thermal transmission properties of thin thermally conductive solid electrical insulation materials, american society for testing and materials, west conshohocken, pa, http://www.astm.org
- astm d 374, test methods for thickness of solid electrical insulations materials, west conshohocken, pa, http://www.astm.org
manufacturer's specifications of samples tested
sample a is a composite material made up of an aluminum substrate, 0.051mm thick, coated on each side with a paraffin based phase change compound. two compound thicknesses were available, 0.025 and 0.046mm. the specified phase change temperature is 60oc and the thermal conductivity value is 0.473 w/moc determined by using astm d 5470. the thermal resistance at 6.89x10⁴ n/m2 (10 psi) is specified to be 2.13x10⁻⁵ m2 oc/w for the 0.025 mm thick compound.
sample b is a polymer based phase change material. the sample tested did not have a carrier or substrate but was all compound. the specified nominal thickness is 0.14 mm. the specified phase change temperature is 45 oc, and the thermal conductivity is 0.709 w/moc per astm d 5470. the thermal resistance is said to be 4.5x10⁻⁵ m2oc/w at 6.89x10⁴ n/m2 (10 psi) clamping pressure.
sample c is also a polymer based phase change compound and had no carrier. the specified phase change temperature is 55oc, and the thermal conductivity is said to be 4.0 w/mk. the test method is not defined. the thickness is specified to be 0.127mm nominal, and the thermal resistance is stated to be 3.87x10⁻⁵ m2o c/w at a clamping pressure greater than 6.45x10⁴n/m2 (5 psi).
|