|
introduction
|
the development of liquid crystal (lc) based thermography over the past 30 years has provided thermal engineers with a relatively inexpensive technique for visualizing and measuring surface temperature. engineers and scientists have successfully used lc thermography to investigate various thermal phenomena in a wide variety of applications. these applications include electronics cooling (figures 1 and 2), gas turbine heat transfer, boiling heat transfer, and fluid temperature measurement.
commercially available, quantitative lc thermography systems have recently begun to emerge from the laboratory into the thermal engineering community. the use of modern high speed computers, solid-state color cameras and image digitizers has helped this emerging trend tremendously (see figures 2 and 3). in order to properly investigate thermal phenomena with lc thermography, a basic understanding of the different types of lc materials is necessary.
|
figure 1. temperature contour plot of a 'hot-spot' on a thin film resistor. from [1], by permission. |
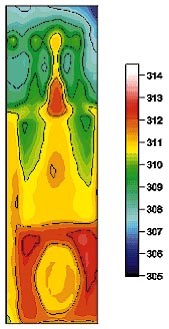
figure 2. temperature distribution on an operating floppy disk drive voltage regulator. from [2], by permission. |
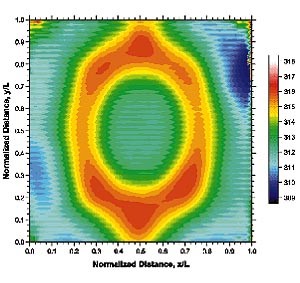
figure 3. temperature distribution under an array of slot jets impinging on a heated surface. from [3], by permission. |
what are tlcs?
at the heart of lc based thermography systems are liquid crystal materials called thermochromic liquid crystals (tlcs). fundamentally, a liquid crystal is a thermodynamic phase that is between the pure solid and pure liquid phases of matter and exists in some organic compounds under certain conditions. at temperatures below the tlc's event temperature, a tlc will be in the solid state and will appear transparent. when a tlc is at its event temperature, illuminated by white light1 and viewed under fixed optical conditions, the tlc material will reflect a unique wavelength2 of visible light (i.e., color).
as the temperature rises through the tlc's bandwidth, the reflected color of the tlc will change. finally, when the temperature exceeds the tlc's clearing point temperature, the material will enter the pure liquid state and will revert back to being transparent. this phenomenon is selective reflection and occurs in most tlcs both on heating and cooling and occurs with minimal hysteresis.
the molecular structure of a tlc gives the material two indices of refraction causing the material to become birefringent. birefringence will cause the selectively reflected light emerging from a tlc to become circularly polarized. the reflected color spectrum for most tlc materials will vary continuously from the longer wavelengths (i.e., red) corresponding to the event temperature to shorter wavelengths (i.e., blue) corresponding to the clearing point temperature. additionally, a tlc material will also transmit a significant amount of the incident light with virtually no modification. viewing tlcs against a non-reflecting, i.e., black, background prevents this transmitted light from adversely affecting the interpretation of the selectively reflected light.
classification of tlcs
the chemical makeup of a tlc material fixes its color-temperature response at the time of manufacture. a simple, two color/temperature designator typically describes this response and can be useful in qualitative applications and for properly selecting a tlc formulation for a particular application. for example, 'r35c5w' designates a commonly used tlc formulation. the 'r35c' signifies that the red, 'r', start or event temperature of the tlc is 35°c. the '5w' signifies that the blue start temperature is 5°c above the red start temperature and this provides users with a crude estimate of the formulation's active bandwidth.
narrow-band tlc formulations have bandwidths below 1 or 2°c, while wide-band formulations typically have bandwidths between 5°c and 20°c. "off-the-shelf" tlc formulations are available with event temperatures ranging from -30°c to 100°c and bandwidths ranging from 0.5°c to 30°c.
due to their inherently oily form, pure tlcs are very difficult to work with and their thermal performance degrades rapidly due to chemical contamination and exposure to ultra-violet radiation. to combat these effects, two manufacturing processes, microencapsulation and polymer dispersion, have emerged that attempt to protect the raw tlc material and to make them more usable.
microencapsulation, (me): researchers at the national cash register company pioneered the development of microencapsulation techniques for tlcs in the early 1970's. microencapsulation is a chemical process that takes raw tlc material and encases it in protective 5-10 micron diameter capsules. custom tailored, sprayable formulations consisting of tlc-filled microcapsules suspended in a water-based binder material are commercially available for virtually any application. the me process offers superb chemical contaminant resistance and good radiation protection and it can also make the tlc surface less sensitive to the lighting-viewing geometry. however, special care is necessary to properly prepare and apply me-tlcs in order to avoid problems associated with over-attenuation of the reflected light coming from the tlcs and segregation of the binder and the micro-capsules.
polymer dispersion, (pd): researchers originally designed polymer dispersion methods for tlcs to facilitate the manufacture of continuous castings and sheets of tlc material. the process chemically disperses pure monomer-based tlc material into a solid polymer-based matrix. a key benefit of this process is that the virtually transparent polymer material only causes mild attenuation of the reflected light from the tlc. this feature preserves more of the brilliant color response characteristics of the raw tlc material.
however, pd-tlcs are fairly limited in their usability for two reasons:
1) they are not typically available in a sprayable medium, limiting use to relatively flat surfaces;
2) edge effects due to chemical contamination can destroy a pd-tlc surface when a cutout portion of a manufactured sheet is used.
qualitative temperature visualization techniques
many temperature visualization applications only require qualitative information. in these applications, the two color/temperature descriptors of the tlc material combined with the color response capabilities of our own eyes can readily provide a very simple solution. qualitative tlc techniques are typically easy and inexpensive to implement and can provide high spatial resolution when properly used in an application that provides suitable optical access to the tlc coated surface. a typical qualitative tlc application could provide a quick investigation of an electronic component's temperature response to changes in thermal conditions like air flow rate and direction or component orientation.
other qualitative tlc implementations may include verification of isothermal and adiabatic temperature conditions in computer models of electronics cooling situations. many quantitative measurement techniques that use the tristimulus (or three input) color response system of the human eye to infer the tlc temperature have their origins in these types of qualitative measurement techniques.
quantitative temperature measurement techniques using narrow-band and multi-event narrow-band tlc formulations
most quantitative lc thermography applications have used narrow-band me-tlc formulations or multi-event temperature mixtures of several narrow-band tlcs each having different event temperatures. collected data from successive experiments at different surface temperatures or power levels facilitates construction of the surface isotherm patterns using single- or multi-event formulations. narrow-band tlc formulations can allow accurate verification of the surface temperature distribution of presumably isothermal objects.
the small range of valid temperatures in these formulations permits making highly accurate relative temperature measurements using narrow-band tlc formulations and simple image processing systems. in situ color-temperature calibrations are usually sufficient to provide reasonably accurate absolute temperature measurements with these formulations. on the down side, computations of multi-event isotherm patterns are usually very tedious and time-consuming and the implementation of full-field measurement capabilities is difficult with narrow-band formulations.
using wide-band tlc formulations
an alternative to using narrow-band tlcs is to use the wider bandwidth of a single wide-band tlc to map the isotherm (i.e., isocolor) pattern of a surface from a single image. these wide-band techniques are useful when an object has large temperature variations or when accurate measurement of an object's surface temperature distribution warrants high spatial resolution. practical applications of wide-band techniques are numerous. they include the investigation of the surface temperature distribution in such areas as gas turbine blade cooling, electronic component characterization and the study of boiling heat transfer phenomena. figures 2 and 3 show some examples of these applications.
the development efforts of lc thermography systems have shown that the following issues are crucial when an application requires high measurement accuracy from wide-band tlc formulations:
- accurate and efficient descriptor of color that is usable in tlc applications.
- tlc color-temperature response calibration.
- lighting and viewing effects.
| comparison of narrow-band and wide-band techniques |
| |
advantages |
disadvantages |
| narrow-band |
- high accuracy absolute and relative temperature measurements can be readily obtained
|
- construction of an isotherm pattern can be tedious and time-consuming.
|
| |
- inexpensive implementation requires simple image processing systems
|
- full-field capabailities of the tlc coating are not utilized.
|
| wide-band |
- uses the tlc's bandwidth to map the entire isotherm pattern of a surface from a single image
|
- robust tlc color-temperature response calibration is necessary for high accuracy measurements.
|
| |
- preferred in applications having large temperature variations which require high spatial resolution
|
- more expensive to implement because more sophisticated image processing systems are required.
|
| table 1. advantages and disadvantages of using narrow- and wide-band tlc formulations in lc thermography systems. |
color descriptors: since color is a subjective entity, it can be difficult to quantify. however, many physiological studies have proved that the rods and cones of the human eye decompose color into a combination of the red, green and blue (rgb) primary colors. many modern machine vision systems have implemented this natural tristimulus decomposition as an attempt to emulate the human vision system. these systems store the appropriate amounts of red, green and blue needed to produce a correspondingly matched color response at each point in an image. however, this implementation is not very efficient for lc thermography because it requires that three values (red, green and blue, for example) be used to interpret the temperature at each point in an lc thermograph. furthermore, these rgb color measurement models alone are difficult to use in applications that have non-ideal optical conditions present. however, recent development efforts have formulated very robust and computationally efficient single value color descriptors tailored specifically for lc thermography that are based on the standard rgb vision model, [5].
color-temperature response calibration: prior knowledge of the input to output response characteristics of a measurement sensor is crucial to proper implementation and use of that sensor. in lc thermography applications this means, ideally, that the intrinsic color-temperature response of the tlc be known as well as any other inputs that may affect this response including the measurement system itself.
the simplest way of doing this is to directly calibrate the tlc and color measurement system response characteristics in place, or in-situ. this method requires the apparatus under test be equipped with an external means of controlling and measuring the tlc temperature at or near the surface area of interest. this method can be difficult or impossible to implement in some applications and typically produces response characteristics that are not only specific to the color measurement system and tlc, but to the actual application itself.
alternatively, many researchers have focused on developing more system independent calibration methods with the intent of extracting the intrinsic color-temperature response of the tlc itself. these efforts have implemented successive-isotherm and gradient techniques.
successive-isotherm methods typically use a temperature controlled test surface and a color measurement system to generate tlc color-temperature calibration data. data acquisition commences by bringing the test surface and tlc to the tlc's event temperature. next, a color image of the surface is taken and an average color value is computed and stored with the temperature of the test surface. this process is then repeated at subsequently higher temperatures until the clearing point temperature is reached. though seemingly simple to automate, successive-isotherm methods can be very time consuming and typically suffer from poor color-temperature resolution and large amounts of required data processing.
gradient methods attempt to overcome many of the shortcomings of successive-isotherm methods by subjecting a tlc material to a measurable color-temperature distribution, such as a linear temperature gradient. when properly implemented, a gradient technique can provide a continuous rather than discrete representation of the entire color-temperature response for a tlc using a single color image. these gradient methods provide much higher color-temperature resolution than successive-isotherm methods in a fraction of the time and with much less data processing.
unfortunately, the development of these advanced calibration methods has not been able to completely eliminate the color measurement system from the tlc color-temperature calibration. however, due to their fundamental approach, they have significantly enhanced our understanding of many important issues associated with lc thermography.
lighting and viewing: the perceived color of a pure tlc (at any fixed, active temperature) is dependent on the lighting-viewing arrangement and on the amount of background and/or secondary light present. however, research has shown that using a co-aligned primary lighting-viewing system in the absence of any background or secondary light, can minimize this dependency, [7]. furthermore, the signal to noise ratio in these systems can be can be greatly enhanced by cross polarizing the lighting-viewing system to maximize the transmission of the circularly polarized light being reflected by the tlc.
sources of temperature measurement error
temperature measurement error effects have been difficult to quantify in lc thermography applications. this is mainly due to the large number of possible error sources and the effects these sources have on the overall temperature measurement accuracy of an lc thermography system. however, most measurement errors can be attributed to one or more of the following effects:
- improper surface preparation and/or application of the tlc material.
- improper calibration and/or interpretation of the tlc color-temperature
- fixed errors associated with the color and/or temperature measurement equipment of the system.
summary
many significant advances have arisen from a considerable amount of fundamental and applied research and development of tlcs and lc thermography over the past 20 to 30 years. these advances have led to much more stable and usable tlc formulations that cover a wide operating temperature range (15 to 100°c). commercially available lc thermography systems have recently become available which use color measurement models tailored to the complex response characteristics of tlcs and state-of-the-art electronics technologies, in order to deliver cost-effective and reliable temperature measurement performance. however, regardless of how impressive an lc thermography system may appear to be, there is no replacement for the knowledge of how best to use the available tlc technology.
the following set of 'how-to' guidelines should be helpful when considering to use of lc thermography in an application:
- determine the expected minimum and maximum temperatures of the surface(s) in question.
- select an appropriate tlc for this temperature range: narrow-band, multi-event or wide-band.
- properly prepare and apply the tlc material and black background to the test surface.
- provide adequate optical access to the surface and minimize unwanted reflections.
- provide an on-axis lighting and viewing arrangement if possible with crossed polarizers.
- calibrate the color-temperature response of the tlc and imaging system if quantitative measurements are needed.
- image/visualize the active tlc surface.
- relate color to temperature using the appropriate color-temperature calibration for the tlc.
notes
- to be more precise, this wavelength of light is actually the dominant wavelength of a continuous wavelength spectrum and the dominant wavelength is of the most interest, [6].
- in this discussion white light denotes light that contains all the wavelengths of at least the visible portion of the electromagnetic spectrum.
dino j. farina
image therm engineering, inc.
waltham, ma
references
1. azar, k., j. r. benson & v. p. manno (1991) liquid crystal imaging for temperature measurement of electronic devices. ieee semiconductor thermal measurement and management symposium, phoenix, az, pp. 23-33.
2. batchelder, k. a. & d. j. farina, personal communication, august 9, 1995.
3. danek, c. j. & r. j. moffat, (1995) low aspect-ratio impingement cooling of electronics with turbulence augmentation. advances in electronics cooling, proceedings of the asme/jsme interpack 95, maui, hi, pp. 837-842.
4. farina, d. j. & r. j. moffat, a system for making temperature measurements using thermochromic liquid crystals. report number hmt-48, stanford university, department of mechanical engineering, thermosciences division, stanford, ca, september, 1994.
5. hacker, j. m. & j. k. eaton, heat transfer measurements in a backward facing step flow with arbitrary wall temperature variations. report number md-71, stanford university, department of mechanical engineering, thermosciences division, stanford, ca, june, 1995.
suggested reading
6. collings, p. j., liquid crystals: nature's delicate phase of matter, princeton university press, princeton, 1990.
7. farina, d. j., j. m. hacker, r. j. moffat & j. k. eaton, (1994) illuminant invariant calibration of thermochromic liquid crystals. experimental thermal and fluid science, vol. 9, no. 1, pp. 1-12.
8. parsley, m. hallcrest handbook of thermochromic liquid crystal technology hallcrest, inc., glenview, il, 1991.
|