|
introduction
the use of heat pipes in thermal management is increasing rapidly as power densities in electronics continue to rise. heat pipes are attractive because they can typically carry 100 or more times as much heat as an equivalent piece of solid copper.
the basic principle of heat pipe operation is very simple. a small amount of working fluid, typically water, is sealed inside a closed tube, figure 1, which is equipped with a wick material that can transport the liquid by capillary action even against gravity. the wick can be made of metal powder, fine screen, or simply grooves cut on the inner surface of the tube.
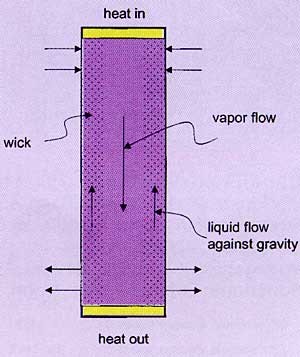
figure 1. schematic view of a heat pipe. the orientation shown requires the
wicking of the working fluid against the force of gravity.
if one end of the tube is heated, evaporation of the liquid increases the pressure there and causes vapor movement to the other end where it condenses, effectively transporting heat at the rate p:
p=ldm/dt (1)
where l is the heat of vaporization per unit mass and dm/dt is the mass evaporation rate. the condensed fluid is carried back to the evaporation section by the wick to continue the cycle.
the analysis of heat pipe operation rapidly becomes much more complicated if one considers the retarding force of viscosity in both the liquid and vapor, or such phenomena as supersonic shock waves or boiling, both of which can limit the performance at high power. a great deal of research has been focused on this behavior [1-3], and a thorough understanding of these effects is necessary when designing a heat pipe.
for the present article, however, we take the point of view of the potential user for whom the heat pipe is a sealed tube with rather unusual thermal properties, even though it appears from the outside to be a simple metallic rod. the basic difference is that a solid rod of copper, for example, conducts heat by diffusion, and a constant, geometry-independent thermal conductivity can be defined for the material. a heat pipe, however, conducts heat by transport of the vapor and therefore is more properly thought of as a heat current device rather than a simple thermal resistor.
for example, a heat pipe rated at 10w can carry that heat current with a certain temperature drop δt, but δt is found to be more or less independent of the length of the heat pipe [1]. thus, heat pipes are remarkable not only for their very low thermal resistance r (small δt) but also for the highly unusual property that r is roughly independent of length. the advantage of using a heat pipe rather than a rod of metal therefore increases with increasing length.
the remarkably low thermal resistance of heat pipes means that careful attention must be paid to minimizing the thermal resistance associated with the interface between the heat pipe and either the heat source or heat sink. this problem is addressed elsewhere [1-3].
we describe here some simple measurements made by a non-expert in heat pipes to characterize a typical heat pipe in an effort to become more familiar with the thermal properties of these devices.
experimental details
the heat pipe used in these measurements was made of copper with sintered cu powder as the wick and water as the working fluid [4]. the outside dimensions were 6.35 mm dia. by 300 mm long. the goal of the measurements was to establish steady state heat flow at various power levels, average temperatures, and angles of inclination, in an effort to map out the thermal characteristics of the heat pipe. a number of precautions were taken to measure these parameters accurately and to prevent loss of heat from the system.
in order to measure the temperature profile along the heat pipe, fourteen thermocouples (0.25 mm dia., type e) were attached with epoxy at equally spaced intervals (figure 2). heater wire (0.125 mm dia. manganin, 42 ) was wound and epoxied directly on a 75 mm section at one end of the heat pipe, defining it as the evaporator section. none of the heater windings touched the thermocouples. ) was wound and epoxied directly on a 75 mm section at one end of the heat pipe, defining it as the evaporator section. none of the heater windings touched the thermocouples.
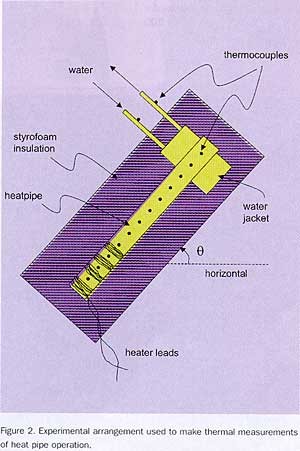
a condensing portion was formed at the other end by a water jacket that consisted of a 75 mm length of 15.9 mm dia. cu tube placed around the heat pipe with rubber seals at each end of the tube. the cooling water was thus in direct contact with the copper heat pipe except in the vicinity of each thermocouple, where the epoxy served as a thermal barrier between the water and the bead of the thermocouple junction, which was pressed against the heat pipe.
stainless steel tubes (6.36 mm dia., 50 mm long) were hard soldered to the cu jacket as inlet and outlet for the cooling water. attached to the stainless steel tubes were 50 mm long sections of 6.35 mm cu tubing equipped with thermocouples on their outside surfaces. these latter tubes, isolated thermally from the copper body of the water jacket, allowed accurate measurement of the inlet and outlet water temperatures, tin and tout .
the water supplied to the inlet was precooled or preheated, as required, and the flow rate was measured carefully (5%). the amount of heat removed by the water was then calculated by:
qout = c(twateravg)δtwater (2) c(twateravg)δtwater (2)
where c is the volume flow rate, c(twateravg) is the heat capacity per unit volume at the average temperature
twateravg=(t in + tout)/2 (3)
and the temperature difference is defined as:
δtwater=tout - tin (4)
the complete apparatus was encased in a block of styrofoam for insulation. the block was cut in half lengthwise and scooped out to form a close fit around the heat pipe and attachments. extra styrofoam (not shown in figure 2) was used around the water inlet and outlet tubes to ensure accurate measurements of tin and tout.
the heater was driven with a variable transformer and the electrical heat input was calculated as:
pe=e2/r (5)
where e is the root-mean-square voltage measured at the heater windings and r is the electrical resistance. with the above precautions with respect to insulation, less than ~10% of the input heat was lost from the system, i.e., qout 0.9 pe. as the exact location of the heat leak is not known, the power p conducted by the heat pipe is taken to be the average of qout and pe.
the apparatus of figure 2 was mounted on a rotatable support to allow operation at angles from  = 90o to -90o, i.e., from working with gravity to working against gravity. = 90o to -90o, i.e., from working with gravity to working against gravity.
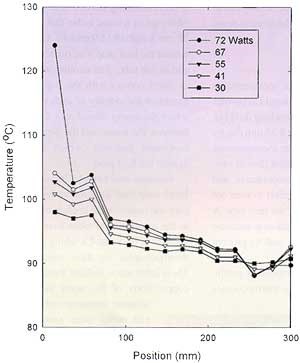 figure 3. temperature profile along the 300 mm-long heat pipe for several different steady-state power levels. the heater section (evaporator) is the first 75mm, while the water-cooled section (condenser) is the last 75 mm. at 72w, the warm end becomes unstable. the heat pipe orientation angle θ is +20o. figure 3. temperature profile along the 300 mm-long heat pipe for several different steady-state power levels. the heater section (evaporator) is the first 75mm, while the water-cooled section (condenser) is the last 75 mm. at 72w, the warm end becomes unstable. the heat pipe orientation angle θ is +20o.
results and discussion
typical data, consisting of the steady-state temperature profile, are shown in figure 3 for five different power levels. the inlet water temperature was adjusted at each power level to maintain roughly constant temperature at the cool end of the heat pipe. at each power level, average temperatures can be defined for the evaporator section (first three thermocouples) and the condenser (last three). (the rise in temperature along the condenser at high power levels may be due to supersonic flow [1]).
the difference δt between evaporator and condenser is seen to rise gradually in the power range 30 -67w. for 72w, the end thermocouple on the evaporator clearly shows runaway performance and for higher powers the temperature profile is unstable. this is illustrated in figure 4, where the approximately linear relationship below ~70w indicates an effective thermal resistance of 0.31oc/w at an average temperature of 95oc and an angle of inclination θ of +20o.
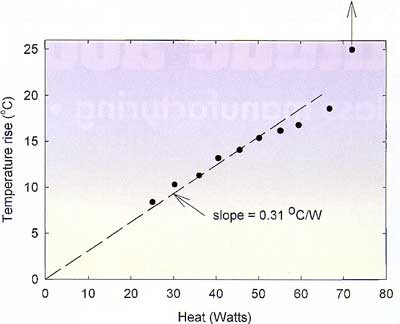
figure 4. the temperature rise along the heat pipe vs. the amount of heat conducted by the heat pipe. a fairly well defined slope is observed up to 70w. orientation: θ = +20o.
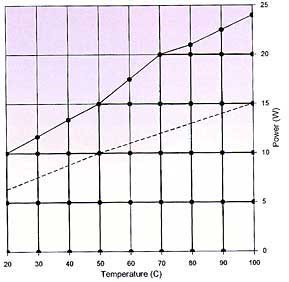
such data can be obtained at many different average temperatures and plotted individually, but we find it helpful to combine them in a 3-d plot of t, p, and δt, as shown in figure 5 for the case of θ=0 (horizontal). the data have been interpolated at 10o c intervals in t and 5w intervals in p for ease of plotting. (the data are limited to temperatures less than ~100oc by the use of water as a cooling agent at the evaporator end, not by the operation of the heat pipe.)
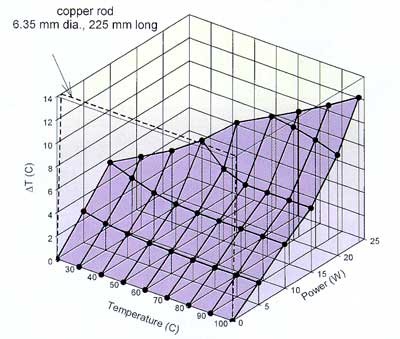
figure 5. three-dimensional plot of data such as that in figure 4, taken at a variety of average temperature. the dashed lines illustrate the much higher thermal resistance of a solid copper rod of the same outer dimensions as the heat pipe. orientation is horizontal (θ = 0o).
one advantage of the 3-d plot is that it indicates clearly the range of t and p over which linear behavior is observed. at higher power levels, the heat pipe is unstable and loses its very low thermal resistance. without the help of the working fluid, the thermal resistance of the heat pipe rises to that of the copper tube alone.
for comparison, the dashed lines show the thermal behavior of a solid copper rod of the same outside diameter and of a length equal to the distance between centers of the evaporator and condenser. the dashed lines represent a constant thermal resistance of 18o c/w, or a factor of 60 higher than the working heat pipe. (the resistance of a copper tube and wick will be even higher.) we point out that while the heat pipe characteristics in figure 5 are expected to be roughly independent of heat pipe length, the resistance of the copper rod (dashed lines) will increase directly with the rod length.
manufacturers of heat pipes typically provide plots of maximum power vs. t. for direct comparison with the data in figure 5, we show in figure 6 a projection onto the p-t plane of the data in figure 5. the dashed line is the maximum p(t) recommended by the manufacturer and is seen to lie well below the onset of instability for this particular heat pipe.
figure 6. projection of figure 5 onto the p-t plane, showing the region of stable operation in bold lines. the dashed line represents the manufacturer's specification for maximum stable heat flow. θ= 0 o.
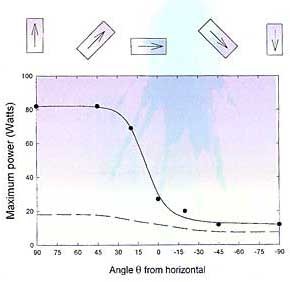
figure 7. dependence of the maximum stable heat flow on orientation for tavg = 95°c. the arrows in the drawings above the figure indicate the direction of the heat flow. the dashed line is the manufacturer's specification for maximum stable heat flow.
the dependence of the maximum stable heat-carrying capacity on angle of inclination is shown in figure 7 for a temperature of 95oc. the maximum power is clearly highest when the condensed working fluid is returned to the evaporator by the force of gravity (> 0). the fact that the heat pipe works at all in the "upside-down" orientation (θ < 0) is due, of course, to the wicking of the condensed fluid against gravity. again, the manufacturer's recommended maximum power is found to be conservative for this particular heat pipe.
conclusion
the measurements reported here illustrate a number of points regarding heat pipes. for power levels below a certain maximum power, the plot of temperature drop  t vs. heat transport p is linear, allowing one to define a thermal resistance r. the value of r is typically 60 times lower than for a simple tube of copper of the same dimensions. as discussed in a number of references [1-3], the value of r for the heat pipe is determined by details of the working fluid, wick construction, etc., but it is fairly independent of the length of the heat pipe. t vs. heat transport p is linear, allowing one to define a thermal resistance r. the value of r is typically 60 times lower than for a simple tube of copper of the same dimensions. as discussed in a number of references [1-3], the value of r for the heat pipe is determined by details of the working fluid, wick construction, etc., but it is fairly independent of the length of the heat pipe.
a 3-dimensional plot of δt, p, and t is found to be useful for seeing at a glance the range of p and t for which one observes linear behavior, as well as the limits beyond which the heat pipe is unstable. comparisons with the manufacturer's specifications indicate that they are well within the range of stable behavior for this heat pipe. the measurements thus demonstrate the extraordinarily low thermal resistance of a typical heat pipe, and it is hoped that they serve as a practical introduction to the operation of these remarkable devices.
john e. graebner
bell labs, lucent technologies
murray hill, nj
references
1. dunn, p.d. and reay, d.a., heat pipes, 3rd edition, pergamon press, 1982.
2. peterson, g.p., an introduction to heat pipes: modeling, testing, and applications, john wiley and sons, inc., 1994.
3. garner, s.d., electronics cooling, vol. 2, no. 3, sept. 1996
4. model hp-1, manufactured by thermacore, inc., lancaster, pa. the selection of a particular heat pipe and supplier was based on convenience and is not intended to serve as an endorsement of a particular product or manufacturer.
|