|
introduction
measurement of the temperature distribution of an operating electronic component, including its junction and case temperatures, is necessary to completely characterize the thermal and electrical performance of today's high power density electronic components. as part of the characterization process, thermal designers must be able to predict and verify the temperature distribution of a component and to identify any thermal 'hot-spots' that might lead to degraded thermal and/or electrical performance.
in this paper we describe lc thermography: a temperature measurement method that uses the color-temperature response of thermochromic liquid crystals (tlcs), to help component designers and thermal engineers make accurate and high resolution surface temperature measurements, quickly and accurately. we also describe spatial resolution and accuracy issues associated with the technique.
what are thermochromic liquid crystals?
thermochromic liquid crystals (tlcs) are materials that change their molecular structure and optical properties with temperature. most tlc surface temperature measurement applications require that the object (i.e., electronic component) be coated with a thin layer of contrast enhancing black paint before applying the tlc material. under these conditions, and when the surface temperature is within the active range for the particular material, a tlc coated surface will reflect a unique wavelength distribution of circularly polarized, visible light having a distinct dominant wavelength (i.e. color) when it is illuminated with white light.
this color-temperature response can then be readily captured by a color camera, formulated into a calibration curve of color versus temperature and used to transform a color measurement system into a very effective tlc based "thermometer", (see [1] for more detailed information.)
using liquid crystal thermography
the proper use of lc thermography typically involves the following steps:
- select a tlc formulation that covers the temperature range of interest.
- set the light source intensity and optical arrangement.
- properly prepare and apply the tlc material to a calibration surface and to the device.
- calibrate the color-temperature response of the tlc and record the data.
- apply sufficient electrical power to the device to induce a tlc color response.
- capture the color image and store it electronically, (see figure 2, for example).
- process this image through the color-temperature response calibration to produce the corresponding temperature distribution of the device, (see [1] for an actual application and figure 3).
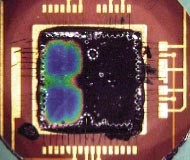
figure 2. color-temperature distribution of an operating electronic device, from [5], by permission. |
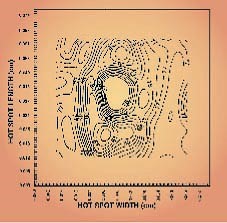
figure 3. temperature contour plot of a 'hot-spot' on a thin film resistor. from [1], by permission. |
liquid crystal formulation selection: the activation temperature and bandwidth of a tlc formulation are determined by its chemical composition at the time of manufacture. the tlc activation temperature is the temperature at which a tlc will begin to reflect visible light. the temperature bandwidth defines the relative color response range for the tlc formulation. tlc formulations with activation temperatures ranging from -30°c to 120°c and bandwidths ranging from 0.5°c to 30°c are commercially available, (see [2], [3] and [4] for more detailed information).
light source intensity and optical arrangement: a sufficiently bright and stable white light source is required to obtain accurate and reliable reflected light intensity measurements from the tlc coated surface. white light sources that remove infrared (ir) and ultra-violet (uv) radiation from their output spectrum are preferred for lc thermography. any ir energy present in the incident light spectrum will cause unwanted radiant heating of the test surface to occur. exposure to uv radiation can cause rapid deterioration of the tlc surface and cause the surface to produce unreliable color-temperature response performance. consistent light source settings and lighting-viewing arrangements between calibration and actual testing of a device is essential to minimize color-temperature interpretation errors. lighting-viewing arrangements can be particularly acute because of the complex light reflecting properties of the tlc surface, (see [2] for more detailed information).
tlc surface preparation: lc thermography is based on assigning temperatures to colors reflected from the tlc coated surface. hence, proper surface preparation can play a crucial role in obtaining high accuracy from this measurement technique. proper surface preparation consists of applying a thin layer of inert black paint followed by a thin coating of the tlc material. the consistency and uniformity of these layers for calibration and test specimen surfaces are essential. if significant differences exist in the consistency of the test and calibration surfaces, the reflected visible light will be adversely affected and measurement errors will occur. experience has shown that the best results are obtained when the test and calibration surfaces are prepared simultaneously.
color-temperature response calibration: the first step in quantitative lc thermography is to calibrate the color-temperature response of the tlc. this step is analogous to calibrating the voltage-temperature response of a thermocouple. color-temperature response calibration of the tlc is done by subjecting the tlc to known temperature levels and then measuring and recording the color response of the tlc. for accurate quantitative measurements, a color sensitive camera should be used to measure the color response of the tlc as these cameras can remove the subjectivity and limited color sensitivity associated with the human eye. the color-temperature response calibration of the tlc is then used to interpret the color response of the tlc when it is applied to the device under test.
image capture and interpretation: the true power of lc thermography is the tlc surface's visual response and so a trained eye can be used for very effective preliminary observations of the electronic device. however, these visual observations are vulnerable to the color subjectivity and sensitivity issues associated with the visual perception of color by the human eye. therefore, accurate and repeatable measurements should be made with solid-state, color cameras and a computer. this approach uses the processing speed and power of modern cameras and computers to quickly and accurately capture and interpret the color images of tlc coated surfaces. figure 1 shows a lc thermography system available from lcimage, [5]. this system contains a temperature controlled calibration surface, color camera and a computer, equipped with a color frame grabber to make measurements of tlc coated devices. figure 2 shows the actual color-temperature response of an active electronic device coated with a tlc having a color-temperature range of: red=~40°c; green=~40.5°c and blue=~41.2°c. the size of the device is 10mm square. figure 3 shows the temperature contour plot of a 'hot-spot' on a thin film resistor. as seen in this figure, the 'hot-spot' is roughly 0.5 mm square. these two figures clearly show the temperature measurement capabilities of lc thermography when applied to electronic devices.
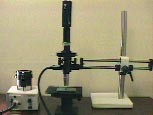
figure 1. lcimage thermography system. from [5], by permission.
challenges in liquid crystal thermography
obtaining accurate and high resolution temperature measurements with lc thermography requires the proper combination of the color-temperature response characteristics of a tlc material and the consistent use of image acquisition and interpretation.
temperature measurement accuracy: the temperature measurement accuracy and temperature resolution of measurements made with lc thermography is directly related to the accuracy and consistency used in calibrating the color-temperature response of the tlc. inconsistencies in the lighting-viewing arrangements present when performing the tlc color-calibration process and interpreting the actual tlc color response of the coated device, can contribute significantly to measurement errors in lc thermography. the optical setup includes the lighting-viewing arrangement and wavelength spectrum of the white light source.
spatial resolution: the highest spatial resolution achievable with lc thermography is limited by the type of tlc formulation and resolving capability of the optical system (camera and lenses). unencapsulated tlc formulations [3] coupled with high performance microscope optics can provide sub-micron spatial resolution over reasonably sized fields of view.
conclusions
liquid crystal thermography was shown to be a viable method for chip to board level temperature measurements. the steps necessary to properly use lc thermography and the method's sensitivity to various parameters have been discussed and highlighted in this paper. since tlcs operate with visible light, traditional optics systems and color cameras can be used to build very cost effective lc thermography systems. these systems can be used to provide accurate, high resolution temperature measurement capabilities in applications ranging from the ultra high resolution, sub-micron device level to larger devices and complete circuit boards.
one drawback of lc thermography in electronics applications is the requirement that the tlc material be applied directly to the device. however, except for the electrical test measurement method, all other temperature measurement techniques available for part level measurements, including infrared thermography, require some sort of surface treatment. hence, considering its capabilities and the reported spatial resolution, lc thermography appears to be a viable technique for chip and board level measurements.
dr. kaveh azar
lucent technologies - bell laboratories
n.andover, ma
dino j. farina
image therm engineering, inc.
waltham, ma
references:
1. azar, k., benson, j.r., and manno, v.p., "liquid crystal imaging for temperature measurement of electronic devices", proceedings of ieee semiconductor thermal measurement and management symposium, phoenix az., pp. 23-33, 1991.
2. farina, d.j., "making surface temperature measurements using liquid crystal thermography," electronics cooling, vol. 1., no. 2, pp. 10-15, 1995.
3. hallcrest, inc.; manufacturer of thermochromic liquid crystal materials, glenview, il, usa.
4. davis liquid crystals; manufacturer of thermochromic liquid materials; san leandro, ca, usa.
5. lcimage, llp; manufacturer of liquid crystal imaging equipment, newton, ma, usa.
|