|
the analysis of convective heat transfer problems pivots on the accurate knowledge of the heat transfer coefficient, h. the heat transfer coefficient is affected by many parameters which have been defined differently by various investigators. for natural convection cases, the temperature distribution is the governing parameter, while for forced convection problems, the fluid velocity is the dominant one. for both of these conditions, the geometry of the problem plays a significant role in determining the value of h.
classical situations, such as flow over a flat plate or through a duct, have been exhaustively examined. the parameters that impact h are well known, categorized and qualified. when there is a departure from the classical problems in terms of the geometry and flow [1 and 2], however, predicting h becomes a challenging endeavor. this is especially true in electronics cooling situations, where diverse geometry and highly non-uniform wall temperatures are the rule, not the exception.
prediction of h is affected by its definition, the reference temperature used to calculate it and conduction coupling through the board. hence, three definitions of h are experimentally compared for their accuracy and utility under different conditions of non-uniform power distribution on the board [3].
convection heat transfer is described by newton's cooling law:
q = ha (ts - tf) (1)
where h is defined by
h = q"/(ts - tf) (2)
here q" refers to the heat flux. ts is the surface temperature and tf is some measure of the fluid temperature (in more general terms, the reference temperature):
to calculate h from equation (2), the convective heat flux and the δt = (ts-tf) must be known. the convective heat flux can be easily determined if all he electrical input of the component goes off as convective heat transfer. the generated heat is then convected away by the cooling fluid from the component surfaces. for a typical component, however, much of the generated heat is transferred by conduction to the board, figure (1). to accurately calculate h, the convective portion of the heat transfer must first be determined, and that is not a simple issue.
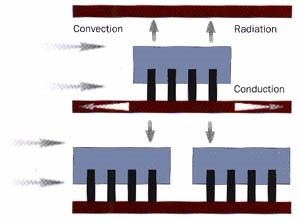
figure 1: heat transfer paths in electronic enclosures.
the temperature difference in equation (2) must be carefully defined. the surface temperature ts can be chosen at the hottest location, or the average between the hottest (centre) and the coolest (corner) temperatures, or some other defined average over the surface. the reference temperature, tf, is more difficult to determine, since the choice appears to be arbitrary. in this work, we distinguish between three different temperatures which might be measured.
these are:
tin = channel inlet air temperature;
tm = mean air temperature based on upstream power dissipation;
tad = the adiabatic component temperature.
tm is given by the following equation:
tm = tin + (σ/mcp) (3)
the adiabatic temperature, tad, is the temperature the component would achieve if there were no heat transfer to or from it by radiation or conduction. the adiabatic condition is theoretically important but difficult to attain in a practical situation.
consider a component some distance inside an air-cooled channel. at the channel entrance, the air temperature is tin; at the considered component the mixed mean fluid temperature is tm; near the surface of the component the effective average gas temperature is tad, the adiabatic surface temperature.
the heat flux from that component can be written in the following ways:
hin = q" conv /(ts - tin), (4a)
hm = q" comp /(tcomp - tm) (4b)
and
had = q" comp /(tcomp - tad) (4c)
each choice of reference temperature defines a different h, and introduces different problems and advantages. tm and tin are either known or calculable from a energy balance, but tad is not so easily found. on the other hand, hm and hin are strongly affected by the wall temperature distribution while had is not.
a series of experiments were conducted to compare the effects of power distribution on h. the experimental setup consisted of a realistic circuit pack in which the components were stimulated and placed on a typical electronic printed wiring board (pwb). this circuit pack contained an array of twelve components placed in four rows (stream-wise) and three columns, figure (2). in this experiment, air inlet velocity was 1.5m/s and wall to wall spacing was 2.54cm.
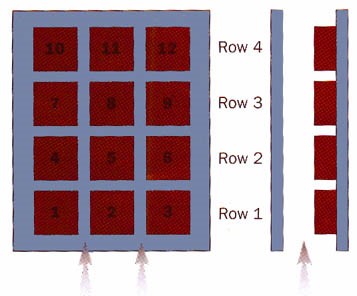
figure 2: experimental setup -- board layout and side view of the channel.
table (1) shows the powering scheme for the 12 experiments conducted. each column corresponds to the power dissipation of a row of components. for example, in case 4, power dissipation of a row of components 1, 2, and 3 was 3 watts each, components 7, 8, and 9 had 1 watt and components 10, 11, and 12 dissipated 3 watts each. cases 7 - 10 show the passive (power off) condition and cases 11 and 12 are baseline tests.
the result reported here focus on components 2, 5, 8, and 11; the components in the center of each row, to avoid edge effects. component 8 (the middle of row 3) was chosen for comparing different heat transfer definitions.
| row --> |
1 |
2 |
3 |
4 |
comp -->
case v |
1,2,3 |
4,5,6 |
7,8,9 |
10,11,12 |
| 1 |
1 |
1 |
1 |
1 |
| 2 |
3 |
3 |
3 |
3 |
| 3 |
1 |
3 |
1 |
3 |
| 4 |
3 |
1 |
1 |
3 |
| 5 |
3 |
1 |
3 |
3 |
| 6 |
3 |
3 |
1 |
3 |
| 7 |
1 |
3 |
0 |
3 |
| 8 |
3 |
1 |
0 |
3 |
| 9 |
1 |
1 |
0 |
1 |
| 10 |
3 |
3 |
0 |
3 |
| 11 |
0 |
0 |
1 |
0 |
| 12 |
0 |
0 |
3 |
0 |
| table 1: experimental configuration and power dissipation per component in each row. |
the behavior of hin and hm. figures (3) and (4) show that hin, and hm vary with row number for the 6 power distributions tested. both h's are highly variable. instead of the monotonically decreasing, as might be so with uniform power, hin and hm increase or decrease sharply in response to the power distribution when the power is not uniform. for the present set of six power distributions, one could define an average h at each row and describe its uncertainty (about ±25%), but that may not be accurate enough for confident design.
for these test conditions, the rise in mean temperature was so small that hin and hm are essentially identical. a lower flow rate would have separated the data more clearly. one should not conclude from these results, the hin and hm are usually so close together. in general hm > hin by an amount that increases further downstream.
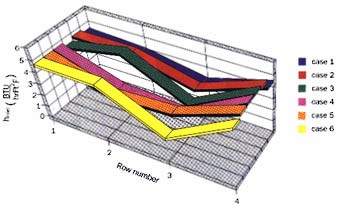 |
| figure 3: variation of hin with row number for six power distributions. |
 |
| figure 4: variation of hm with row number for six power distributions. |
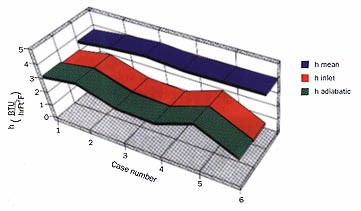
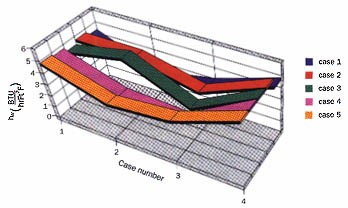
figure 5: variation of h in row 3 with different powering schemes.
the behavior of had. these test were designed to investigate h in row 3 (assumed to be in the fully developed region) and had. was only measured in that one location. hence, there are no figures showing the variation of had with row number. four measurements of had are shown in figure (5). the mean value is 22.5 w / m2 °k and all four data points lie within ±5% of the mean.
this shows that had is a function of the fluid mechanics alone and is independent of the temperature distribution in the system. there is an interesting interpretation for had: it is the largest value that hm or hin could have at the point in question, for pure forced convection with one wall heated. this can be seen by comparing the definitions:
had = q" / (ts - tad)
hm = q" / (ts - tm) = q" / [(ts - tad) + (tad - tm)]
hin = q" / (ts - tin) = q" / [(ts - tad) + (tad - tin)]
it is clear that if tad > tm, then had > hm. this will always be the case for forced convection with one heated wall.
in the present experiments, had, hm and hin were measured on a single component in row 3 of the array for six different power distributions. the results are as follows:
hin varied ±24% around a mean of 15.6 w/m2 °k
had varied 5% around its mean of 22.5 w/m2°k
hm was substantially the same as hin (the fluid temperature rise was too low to make a significant difference)
hm and hin are easier to measure than had but change significantly when the surrounding power distribution changes. if ±25% variation in h and be tolerated, or if the power distribution will not change, then hm and hin are useful.
had is more difficult to measure and to use, but is independent of the power distribution. this makes it attractive for incorporation into computational codes for calculating the temperature distribution in boards with conduction.
| kaveh azar |
robert j. moffat |
| at&t bell laboratories |
stanford university |
| n. andover, ma 01845 |
stanford, ca 94305 |
| |
|
| |
|
| |
|
references:
azar, k. and russell, e.t. effect of component layout and geometry on the flow distribution in electronics circuit packs, journal of electronic packaging; march 1991, vol. 113, pp. 50-57.
azar, k. enhanced cooling of electronic components by flow oscillation, journal of thermophysics and heat transfer, 1992, vol. 6, no. 4, pp. 700-706, 1992.
azar, k. and moffat, r.j. heat transfer coefficient and its estimation in electronic enclosures, national electronic packaging and production conference, pp. 361-372, boston, ma 1991.
|